
|
|
SITE ANALYSIS EXHIBITION On SEPARATE page. CLICK The Underscore: _
LINK TO STUDENT-LED COMMENT REFLECTION (CLICK THE X): X

|
Power, PRIVILEGE, And The PurseIn this project, we assessed the power of interest, poverty, compounding, privilege and more through the power of mathematics.
We used complicated forms of interest and college/life payments to learn how much we would need to retire, and how much money we could spend with the average salary of our dream jobs. We stepped in the shoes of someone with multiple children and minimum wage to see how difficult it is. We learned about the study of statistics, and how they can be manipulated for data, and their power in things like info graphics and graphs. HTTPS://INFOGR.AM/GAY_MARRIAGE_ACCEPTANCE_IN_THE_USA |
Process Of Financial Plan |
During the financial plan, I had quite a bit of trouble. Some of my calculations from previous works were off, and it became very difficult to make anything terribly accurate; my equations didn't work right and I couldn't divvy up my money. However, with help from my peers and Robin, I could succeed. I found out how my equations were wrong, I learned about how to quickly correct my mistakes, and I was uplifted by the fact that I would not be in as much financial trouble as I thought I would be.
|
Infographic and Other Products |
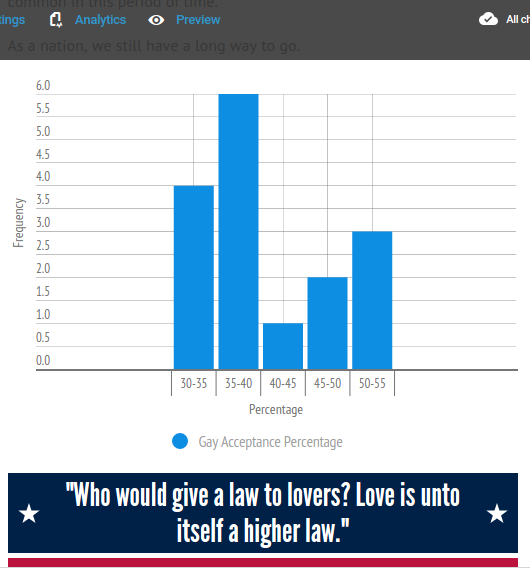
Link: https://infogr.am/gay_marriage_acceptance_in_the_usa
The infographic was slightly easier than the financial plan. It had some difficulty in the fact that usable date was surprisingly hard to come by, especially for my topic of LGBT acceptance. In the end, I had to manipulate the data harshly in order for it to fit into a box-plot and histogram. The histogram actually turned out very well, but was a little difficult to understand without prior knowledge of the histogram format and data. It did turn out well in my opinion, and it talks about something I care about. Other parts of the project were easier in their creation. I had a great time watching videos and giving critique to others, and I really feel like my understanding of statistics, logarithms, and the economy has improved. The quizzes and teaching students have helped greatly with that. |
Deeper Learning
1.) I actually had very little understanding of debt, finance, and economics until now. No one tells you about how it works and you generally are not taught how it works while in school. It's kind of a lose-lose. However, what I learned in this project was extremely in-depth and taught me a lot. I learned how to budget my money, avoid payday loans and credit cards, and much, much more.
The modeling and graphs were helpful in their supplementary help, though I understand on a more literary level. This is clearly seen as I struggle in mathematics on a regular basis. I was especially helped by the financial planning and the study of logarithms, which help my difficulty with square roots.
2.) Exponential growth and decay/compounding was actually one of the most helpful lessons! I just bought some dividends and stocks, and I have to watch it go up and down throughout the days and weeks. It shows how my money will actually compound as it grows, eventually becoming astronomical if left untouched. Graphing examples was also quite helpful.
3.) Logarithms are rather odd, and can be both extremely complex and ridiculously simple at the same time. It truly depends on understanding as well as the relative difficulty of the problem. Unfortunately, I could not tell you the exact way to solve logarithms; I have forgotten. That doesn't mean they aren't helpful, however! They are very good examples of what I call 'reverse squaring.' While that isn't exactly what it is, it helps me. I struggle with things similar to square roots, and logarithms are almost a way to work backwards.
4.) The steps of statistical problem solving are as follows. Question. Design. Analyze. Summarize and Display. Unsurprisingly, Question and Design were already provided in most school work, so I can't speak too much about them. However, Summarizing, Displaying, and Analyzing where very common concepts while looking at data, such as the Poverty Correlation Graphs we worked on. We used all of these steps in our infographic, in which we wrote a paper providing a question, used box-plots and histograms on the Infogram website, and summarized what we found in the most beautiful and effective display possible. I'm fairly proud of my Histogram, which displays something I care about in an efficient manner.
5.) I was not terribly well-informed in the concepts of statistics before this, but I had a general idea about most things, including the study of logarithms, correlation, and other similar concepts. However, I was not familiar with histograms and box-plots. I have encountered box-plots before, and very briefly. I did not understand them. However, this project has introduced me to how incredibly useful these can be for certain situations. While not the most all-encompassing form of graphing(use bar and line graphs for that), I will be quite happy to use these in the future as forms of data, hopefully to my presentation and work's betterment.
6.) While I consider myself a social-justice/awareness advocate, I work from my prior knowledge and with words. Mathematics in this area alludes me. Not anymore.
I had an amazing time understanding the depth of social-justice issues through mathematics. I didn't truly understand the difficult of salaries and the minimum wage until I had made a financial plan for myself. I didn't really know the complications of correlation or the power or quartiles, graphs, and logarithms. I hope this new knowledge makes my discourse even more engaging!
Mind The Gap Exhibition Question:
The exhibition was an absolute success. I had a wonderful time in my panel and learned lots about people I wouldn't usually talk or interact with. I learned how to defend my viewpoint on the fly. I learned about the importance of the community in these projects and the abilities of my classmates.
The panel was the best part to me, but I learned by listening to our statisticians, community members, and the power of good planning. I don't have any pictures, but I remember it clearly. We did a wonderful job!
The panel was the best part to me, but I learned by listening to our statisticians, community members, and the power of good planning. I don't have any pictures, but I remember it clearly. We did a wonderful job!
